The "Message Flow" Tab
The Message Flow tab in the AxonIQ Console provides a visual representation of the flow of messages between different components of your system. This includes commands, events, and queries that are being sent and received by your applications.
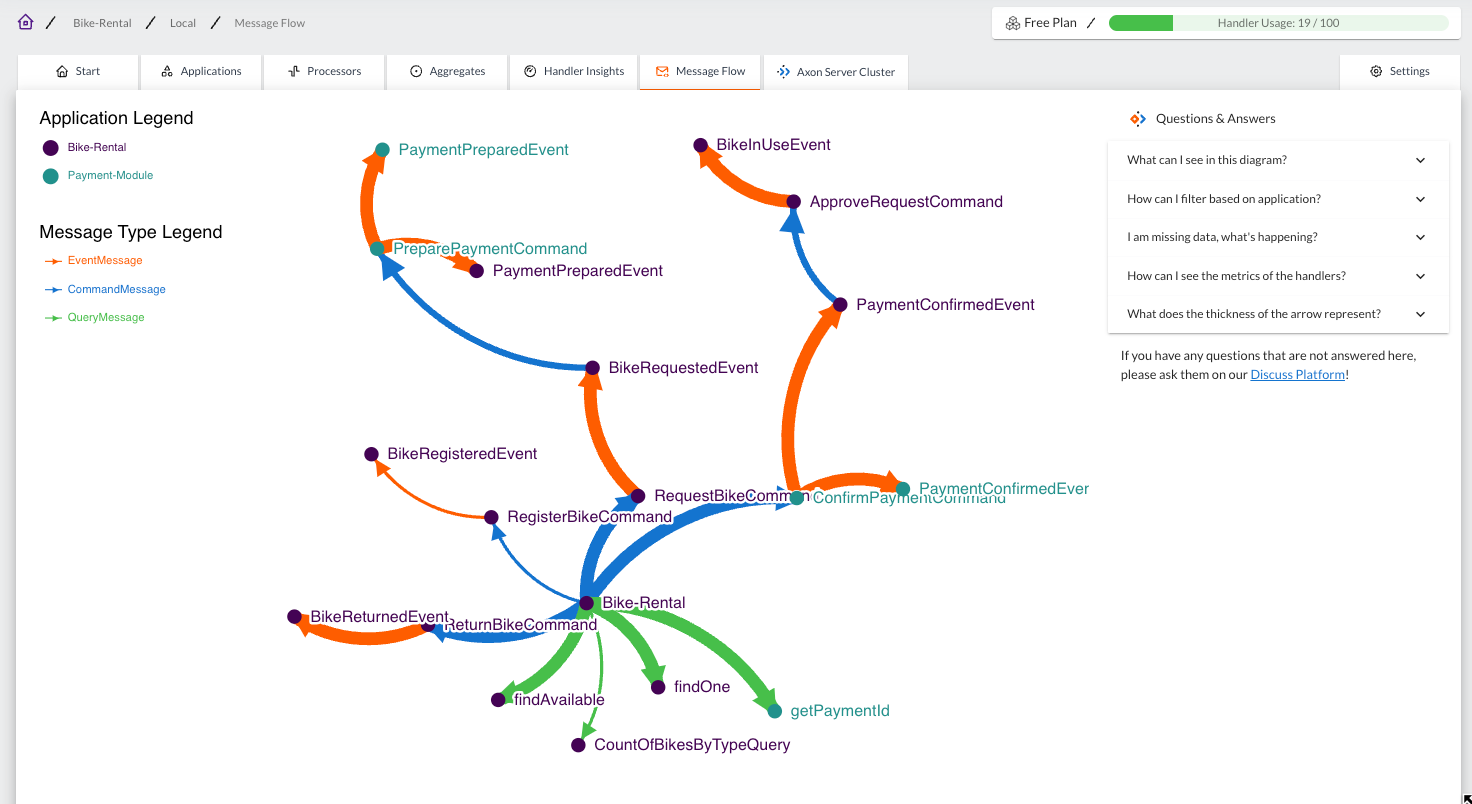
The Message Flow tab can be particularly useful for understanding how data is moving through your system and for identifying any potential bottlenecks or issues. It provides a real-time view of the system’s activity, making it easier to monitor and troubleshoot.
In addition to the visual representation, the Message Flow tab allows you to click through to the Handler Insights, detailing the statistics about each message, including its type, the components it has passed through, and any errors that have occurred. This can provide valuable insights into the performance and health of your system.