The "Aggregates" Tab
The Aggregates tab lists the Aggregates within your Workspace and Environment. So, what exactly is an Aggregate?
In the context of the Axon Framework, an Aggregate is a logical group of domain objects that can be treated as a single unitin regards to data changes. In doing so, they reflect the class’ that are configured as aggregates (for example through the @Aggregate annotation) in your application.
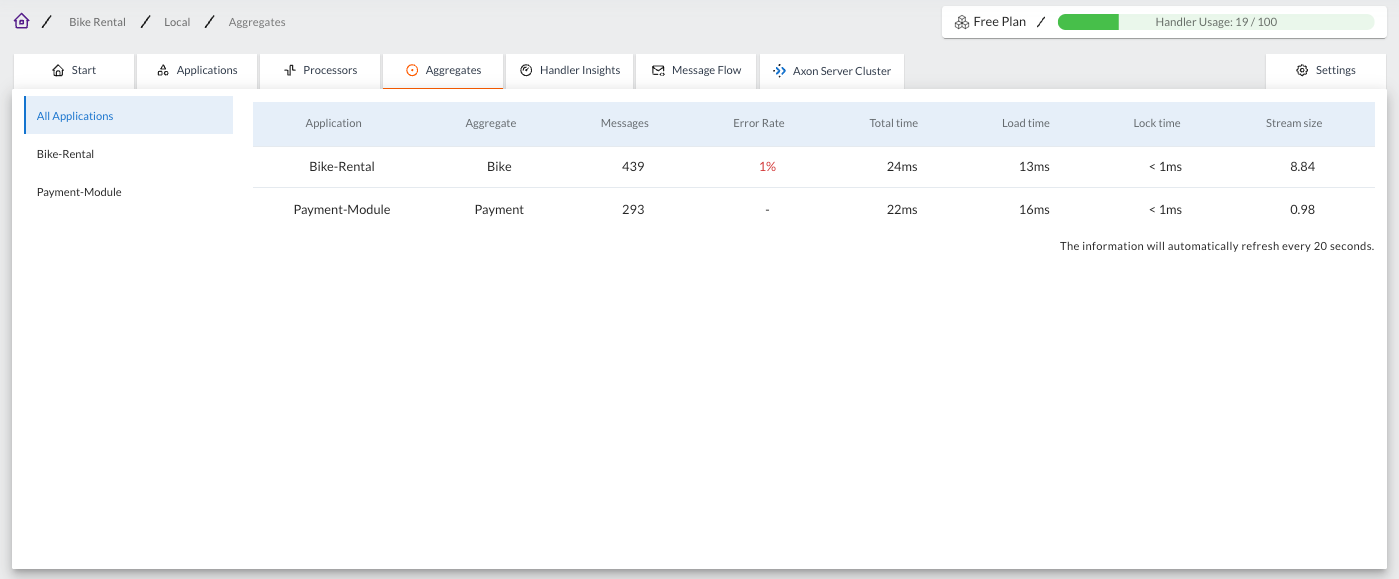
Using AxonIQ Console, developers can get the necessary insight into all the aggregates defined within their system, including their types and instances. As shown in the table above, developers can also see which aggregates are defined per application.
Clicking on any row in the table will provide you with more details on the statistics of the selected Aggregate, just as with Processors.