FAQ for AxonIQ Console
Q: What’s the cost of AxonIQ Console, and is there a free option?
Answer: Yes! AxonIQ Console is free (no credit card required), and you are limited to a maximum of 100 handlers for your environment, however, we also have “Premium” and “Enterprise” plans to easily allow you to support more handlers. See the AxonIQ Console pricing page for more information.
Q: How can I create an account to get started?
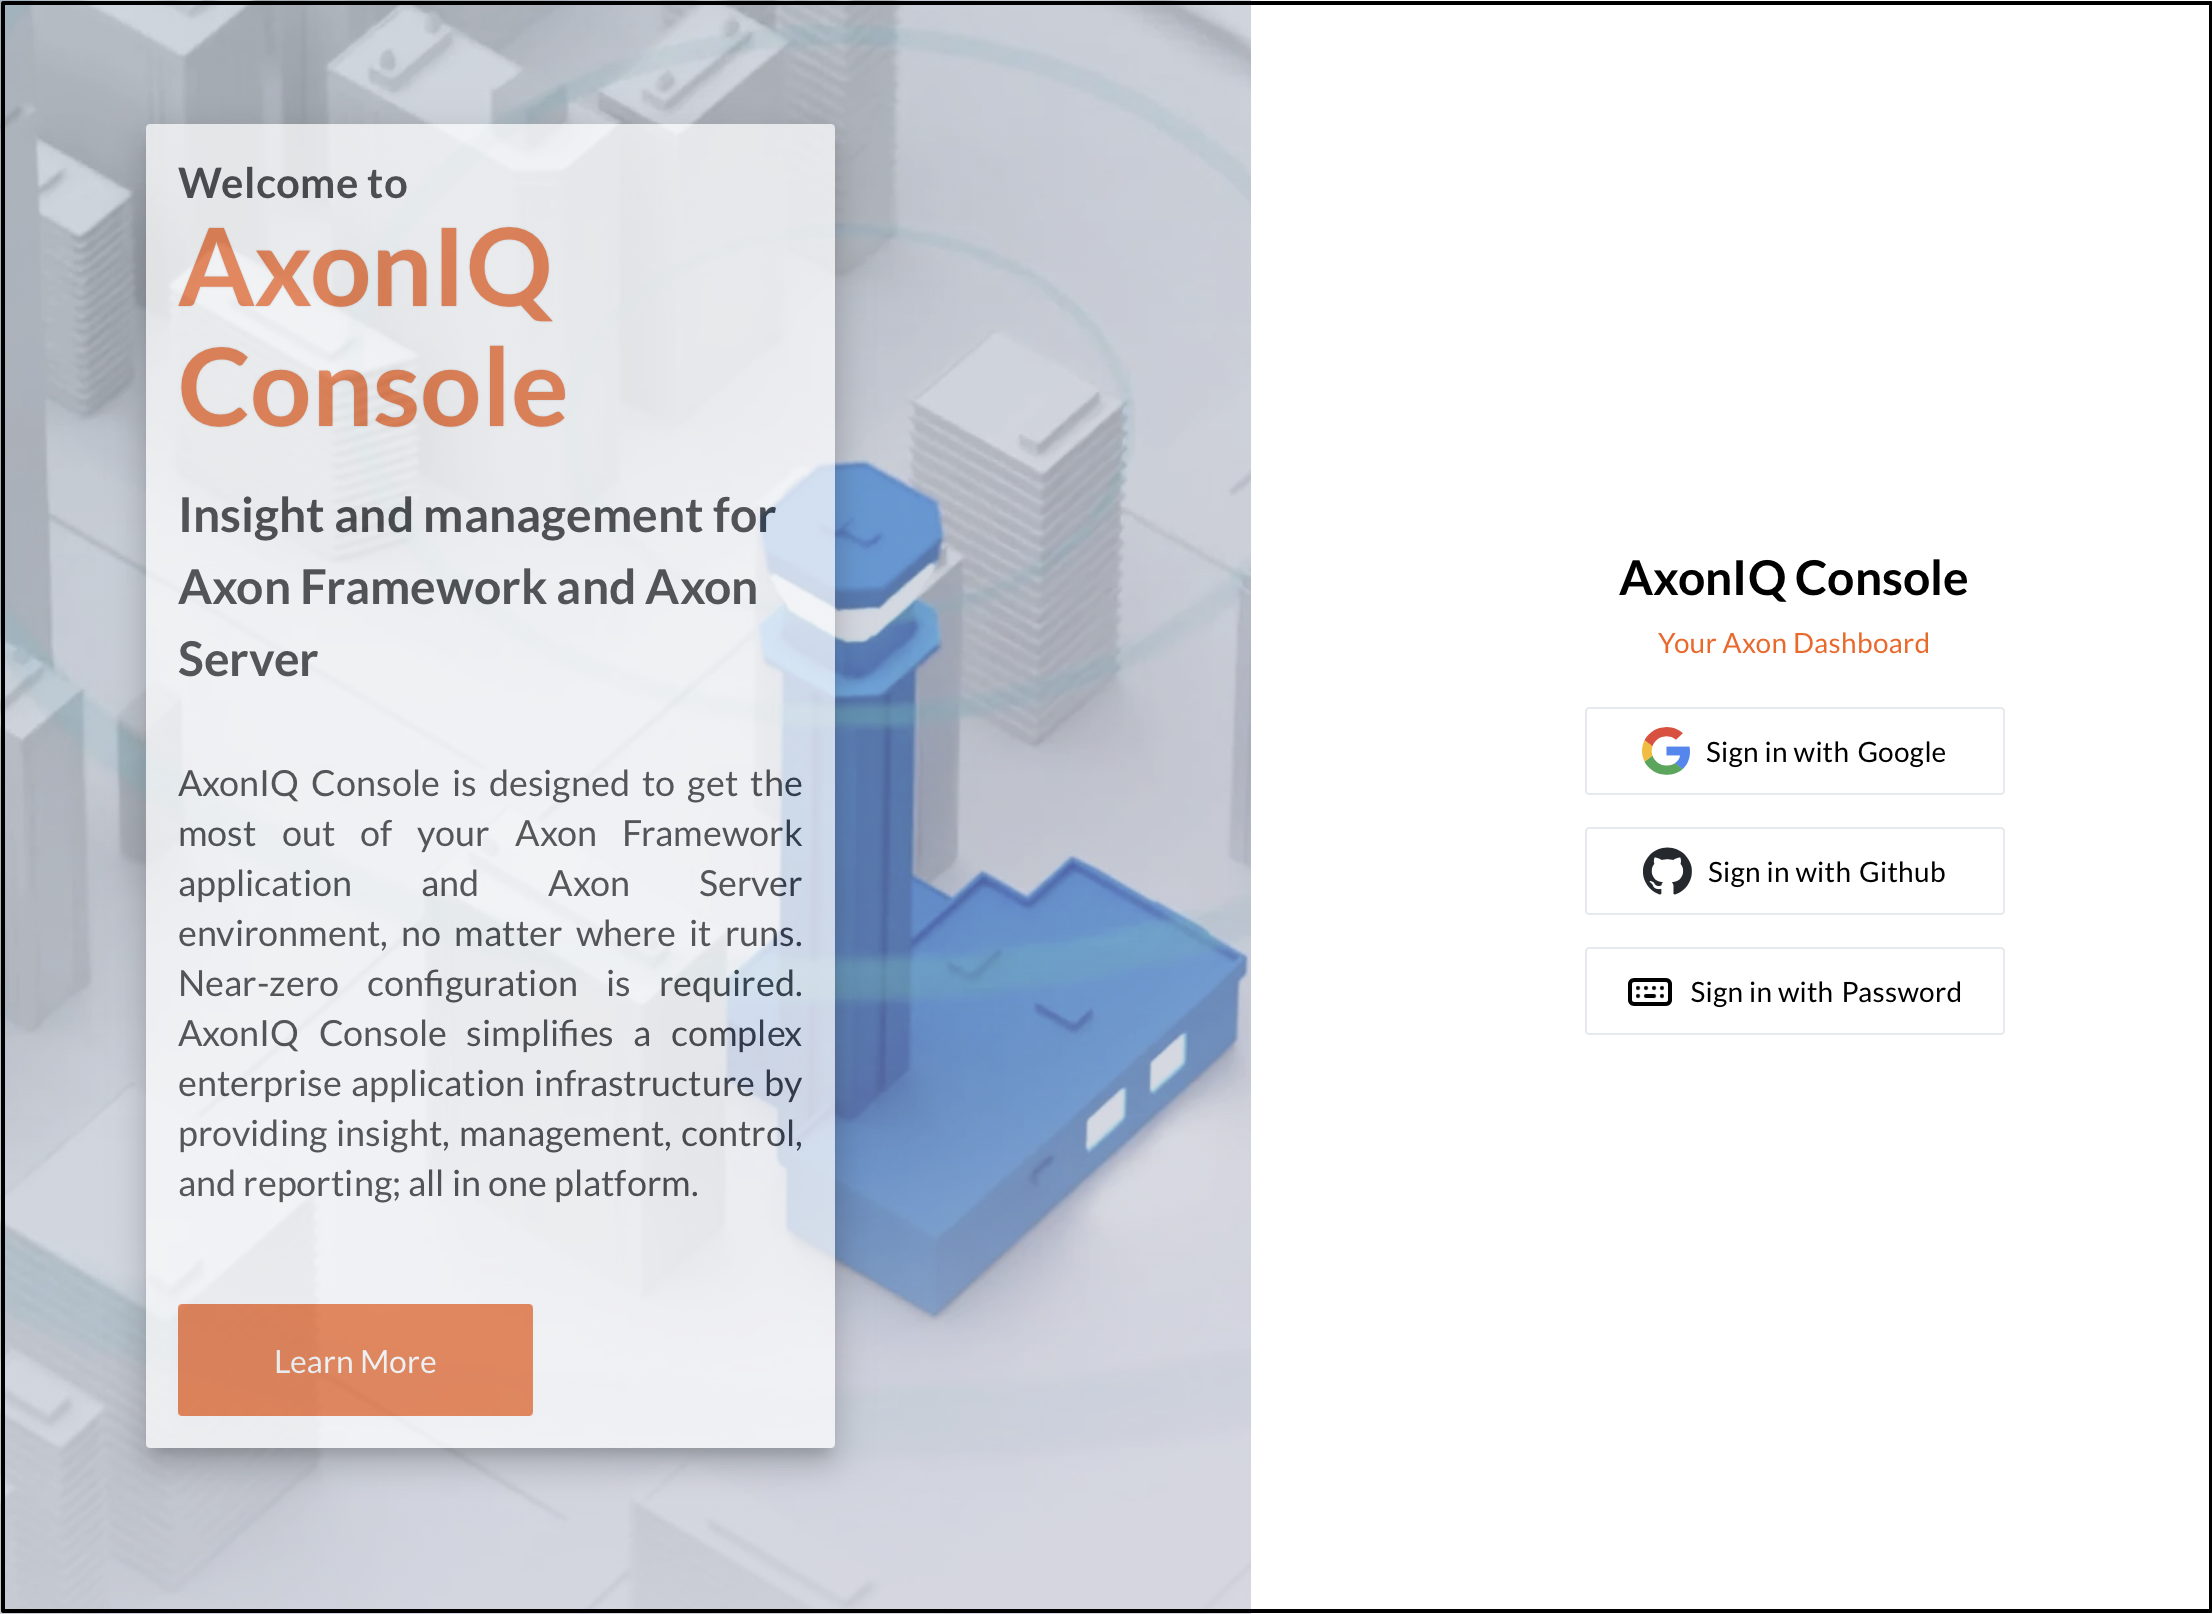
Answer: We give developers various options to get started with AxonIQ Console. If you already have a Google or GitHub account, you can single-sign on instantly and start using AxonIQ Console. You can also create a new account with us by clicking the "Sign in with Password" option.
Sign in to AxonIQ Console now to try it out for yourself.
Q: How do I connect my Applications to AxonIQ Console?
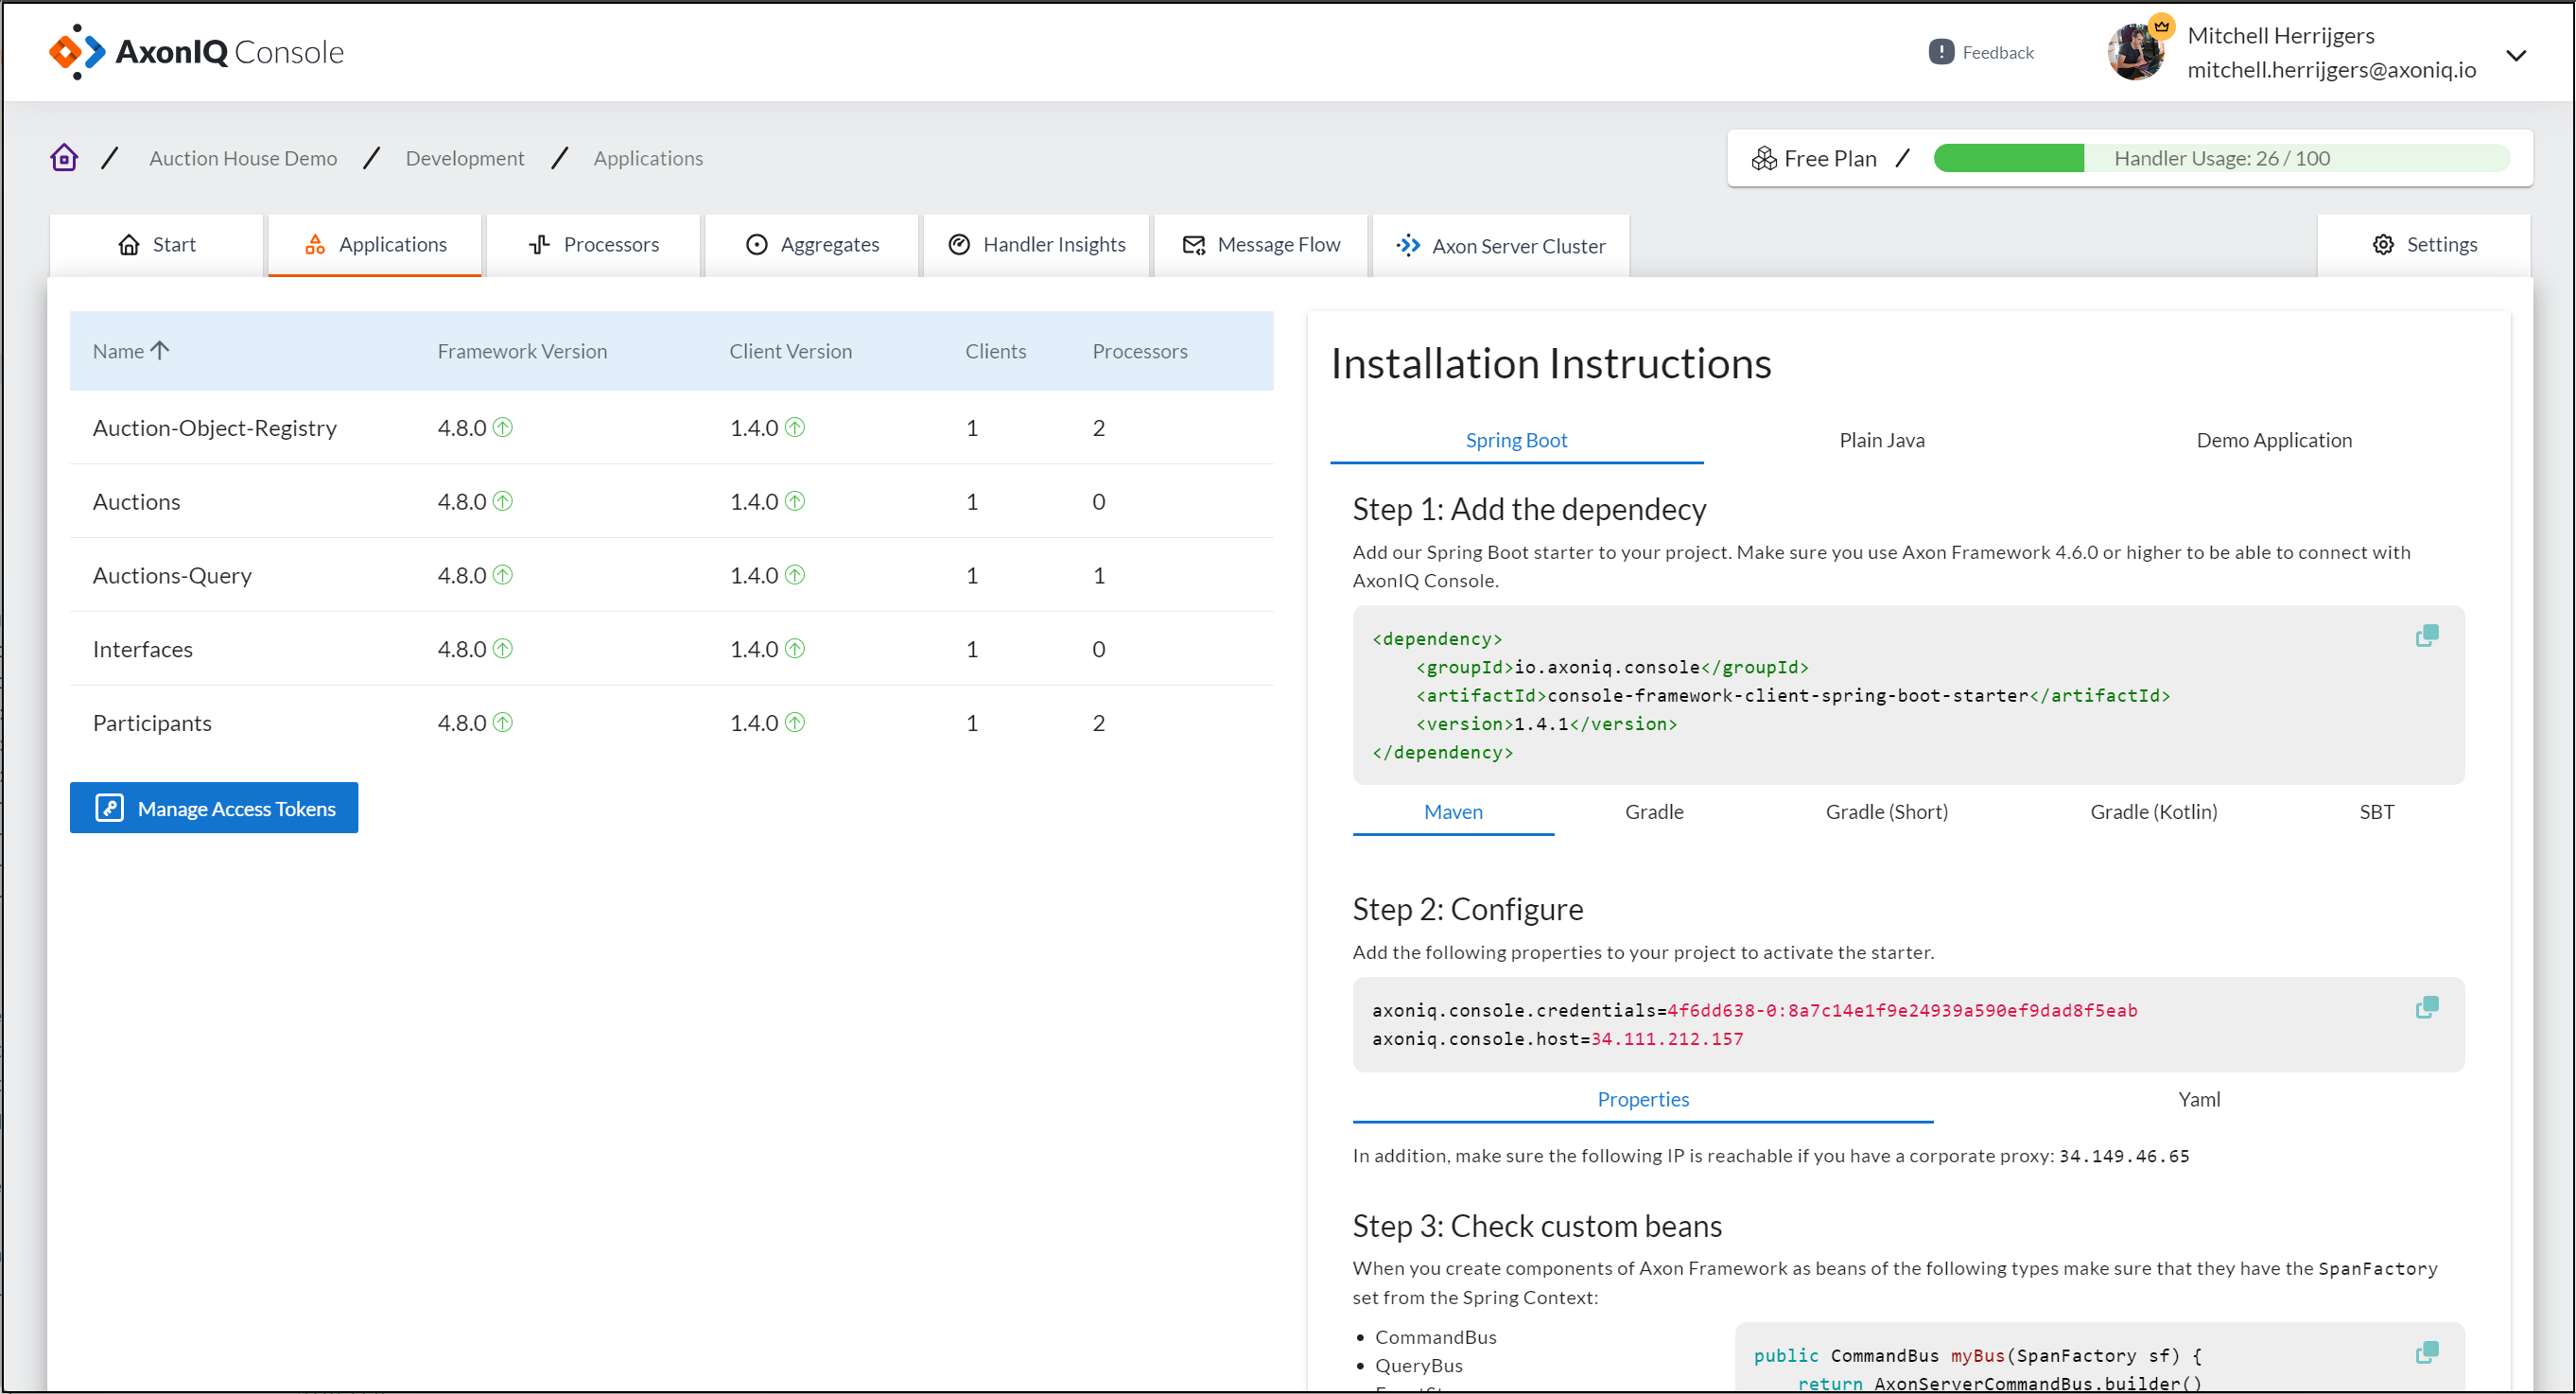
Answer: In order to connect your apps to AxonIQ Console, click on the Applications tab. If you’re using AxonIQ Console for the first time, then no applications will be displayed. However, you will be presented with installation instructions that will allow you to configure your Plain Java projects or Spring Boot applications so that they can be discovered by AxonIQ Console.
You can also find instructions on how to install a Demo Application that has everything already configured and will allow you to see activity instantly in AxonIQ Console.
After your first application has been configured properly, the Applications tab will display all discovered applications.
Feel free to also try out the AxonIQ Console client project on GitHub.
Q: How do I set up Axon Server Nodes within AxonIQ Console?
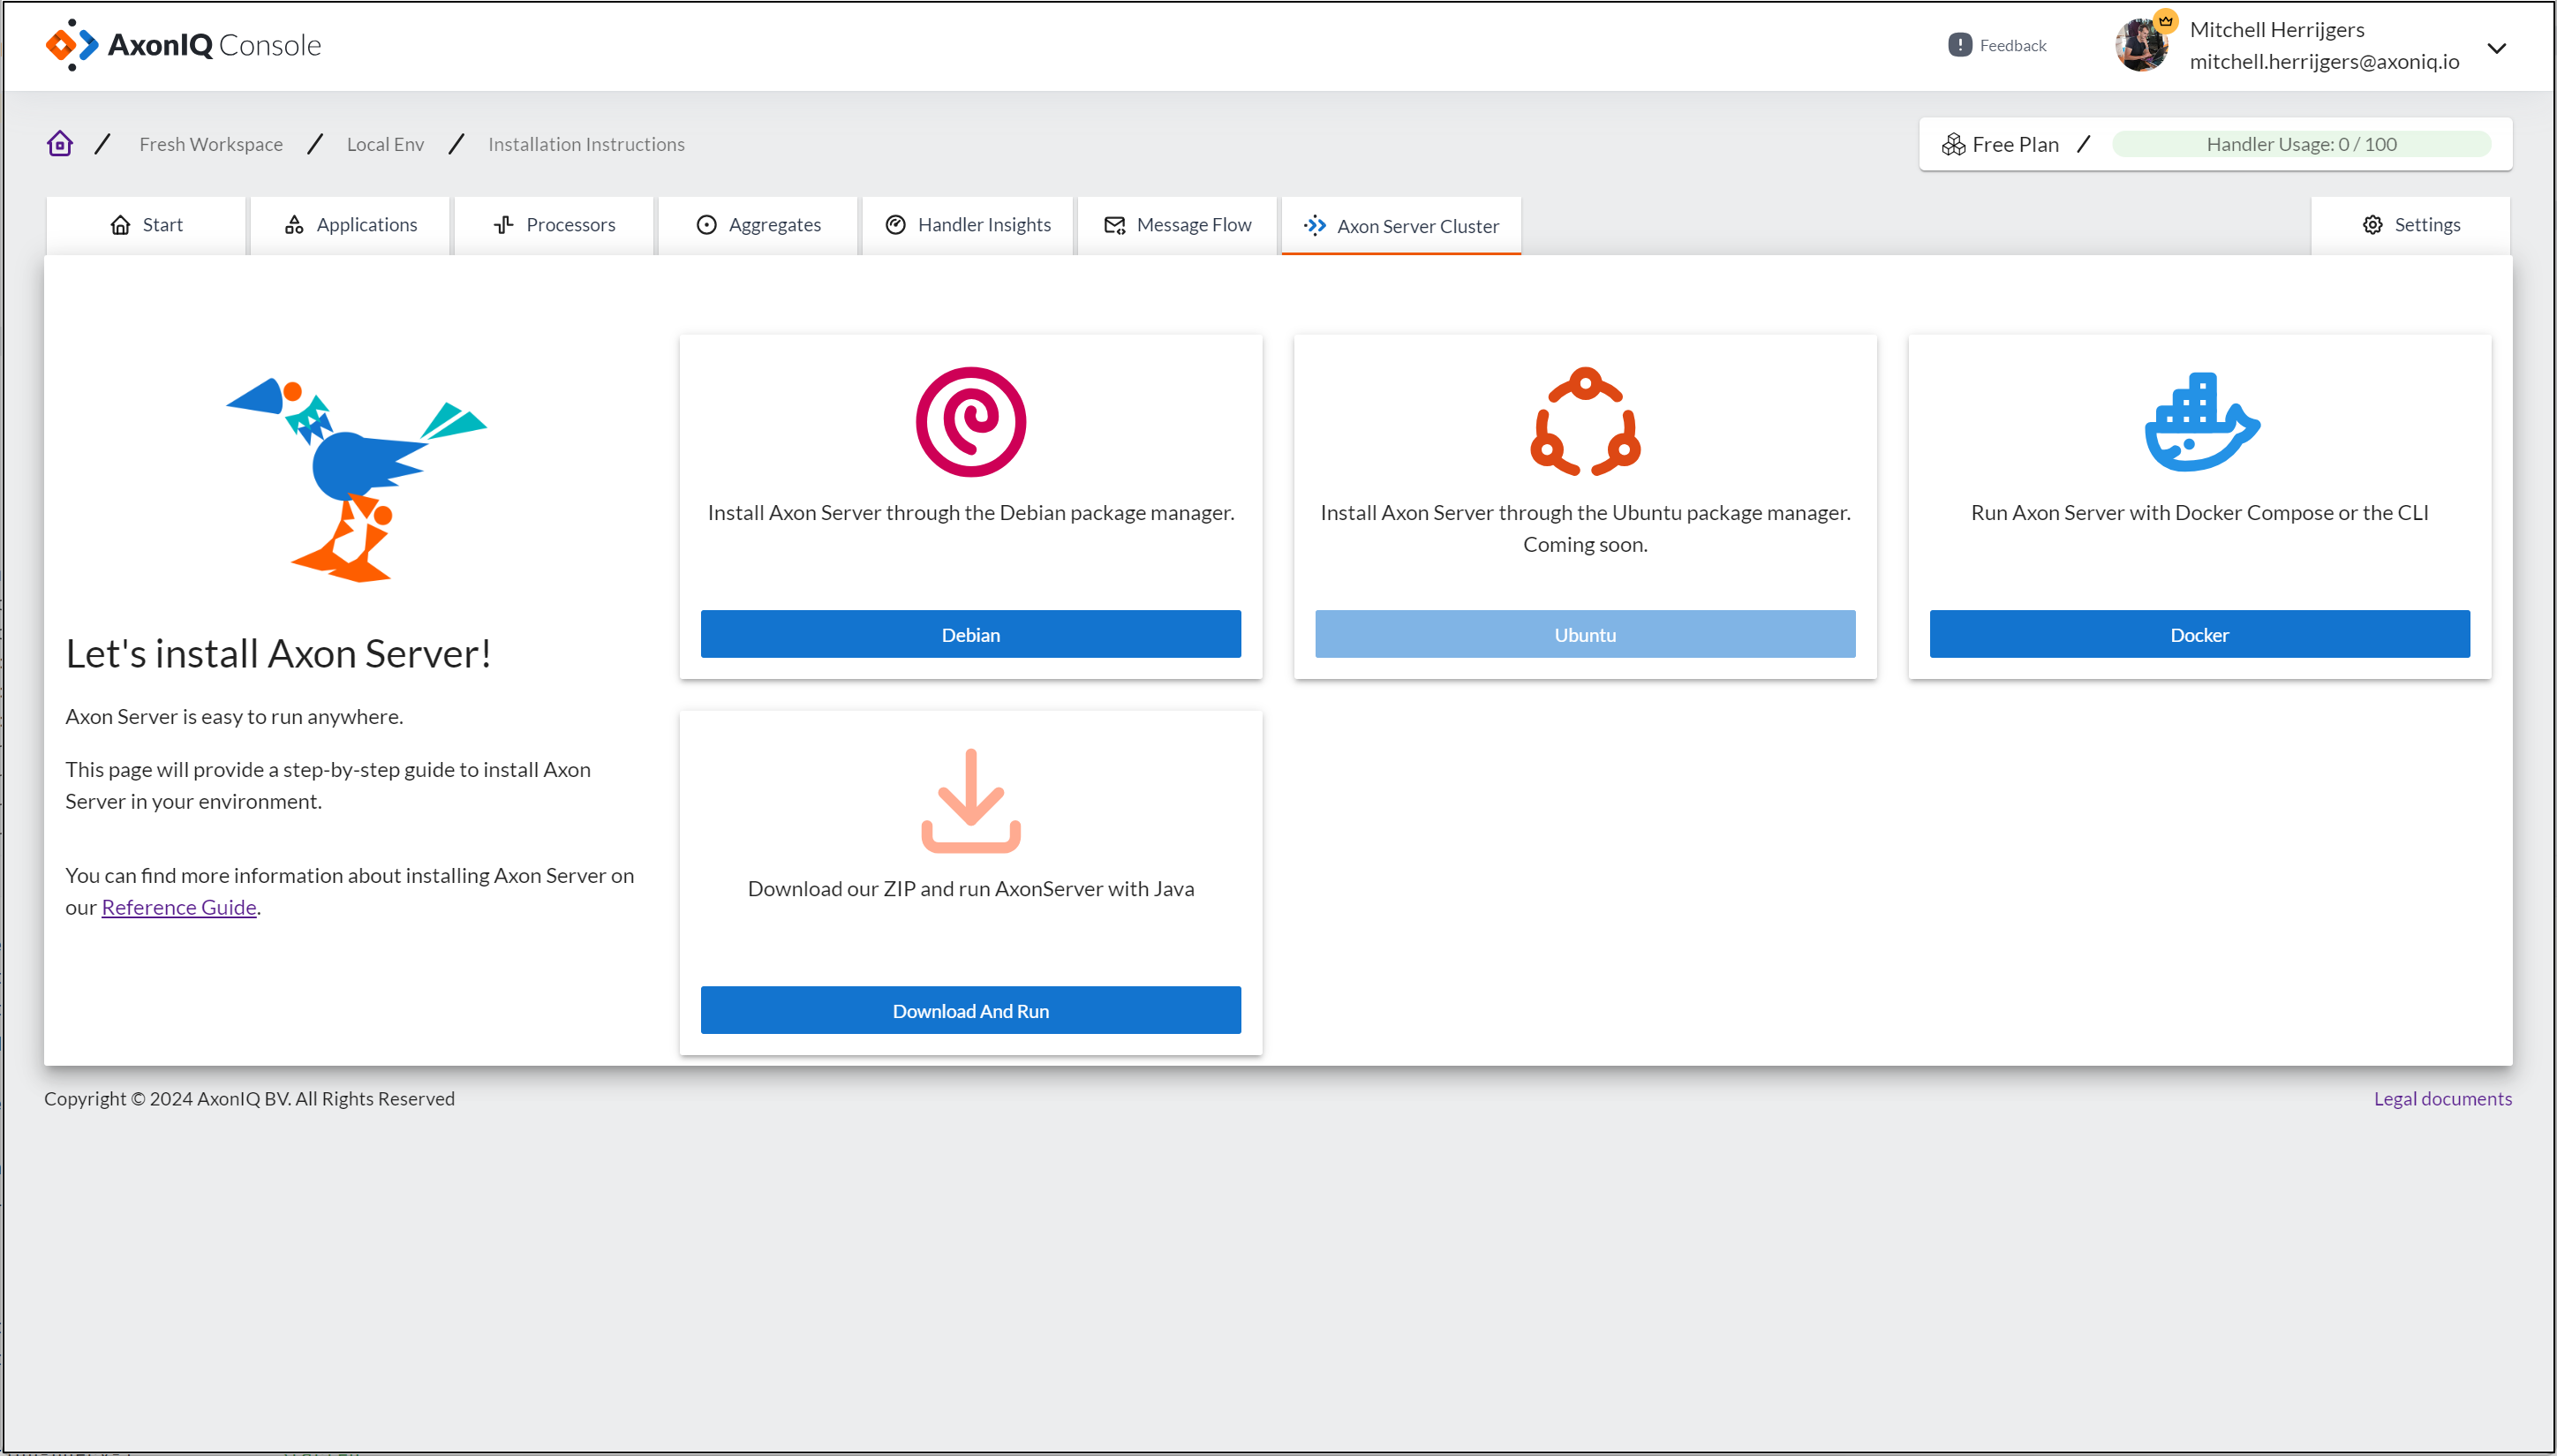
Answer: In order to install an instance of Axon Server, simply click on the Axon Server Cluster tab. Here, you will be presented with various options for installing Axon Server, depending on your operating system or environment.
Q: How can I see the flow of messages for my applications within AxonIQ Console?
Answer: One of the most requested features within AxonIQ Console is the ability to see the flow of messages between applications.
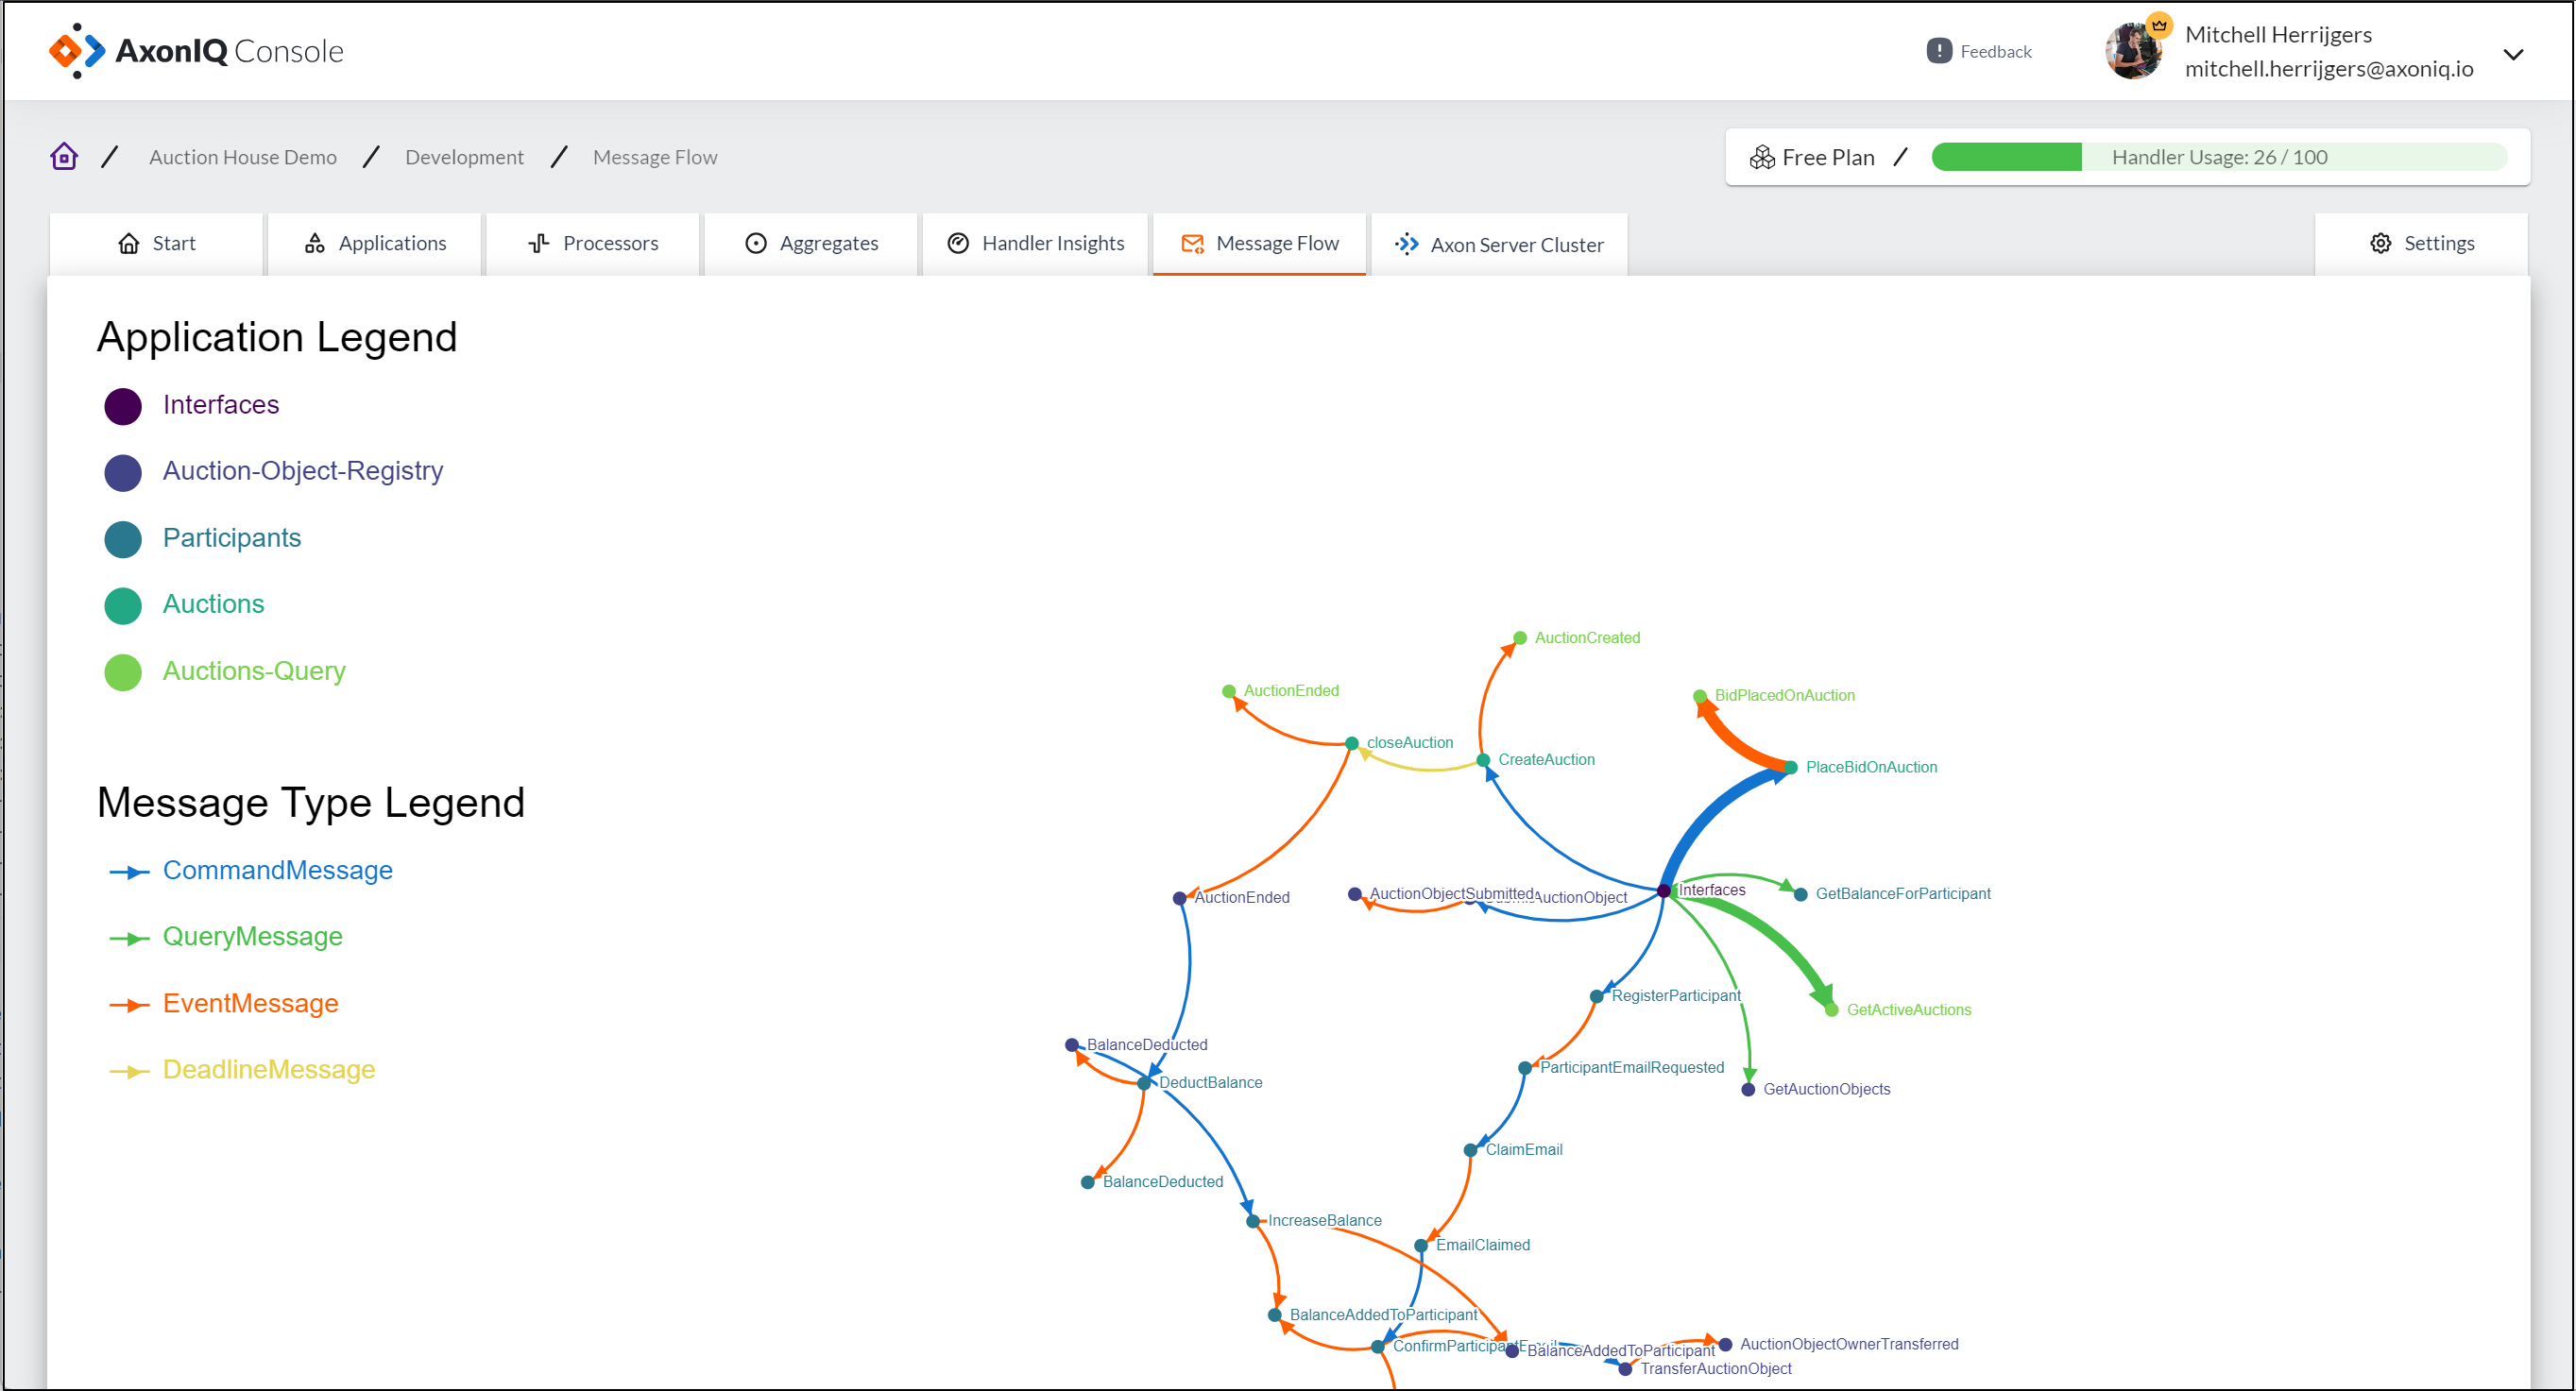
After clicking the Message Flow tab, you’ll see a layout graph of your environment’s publishers and consumers (dispatchers and handlers). Each “dot” in the graph represents an application, and the arrow shows the source and destination of the message. The color of the arrow is significant and represents the following:
-
Blue arrow: Command Messages
-
Green arrow: Query Messages
-
Red arrow: Event Messages
-
Yellow arrow: Deadline Messages
The arrow’s thickness represents the amount of messages sent to the Handler.
Q: I am paying with my credit card monthly. Can I stop my monthly subscription at any time?
Answer: Yes, no problem! Please note that subscriptions are paid ahead monthly. Therefore, if you choose to stop, you still have access to AxonIQ Console until the end of the billing cycle.
Q: We are already using monitoring tooling such as ELK or Splunk. What is the added value of using another tool, AxonIQ Console?
Answer: Tools such as the ELK Stack and Splunk are great for monitoring the status of your network infrastructure. However, AxonIQ Console was explicitly designed for developers to analyze and manage your Axon Framework applications more intricately. AxonIQ Console also enables developers to view the real-time activity of a cluster of Axon Server nodes within a single interface. Therefore, AxonIQ Console can provide insights into the overall health and status of your applications and services in ways that the ELK Stack or Splunk were not designed for.
Q: What is a Handler, and what does “Handler Usage” mean?
Answer: The Axon Framework enables developers to create microservice-based applications using the publish and subscribe pattern. We support three Message types so you can build evolutionary applications. For all three types of messages, you can create a Handler within an application to handle a specific message (or a group of messages, if you prefer).
So, how does the Handler Usage count work?
Each method annotated with a handler annotation counts as a handler. If you have multiple instances of an application, that will be summed. For example, if you have an application with 20 handlers, and run 4 instances, that will count as 80 handlers.
When determining the number of handlers you want in your Workspace, it’s important to also account for the extra handlers that will be needed during deployments. You can view an overview of detailed handler usage on the Subscription page.
Q: What happens if I exceed my Handler Usage Quota?
Answer: Your subscription determines how many handlers we accept data from. We check periodically to see if you stay within this amount and block handlers until the amount is within your subscription again.
Before we block handlers, there is a grace period to allow for the purchase of extra handlers before we stop showing metrics. grace period of a week. After the grace period, we will only allow the original amount in your subscription. You will be notified via logs in your application, e-mail, and AxonIQ Console Web Interface.
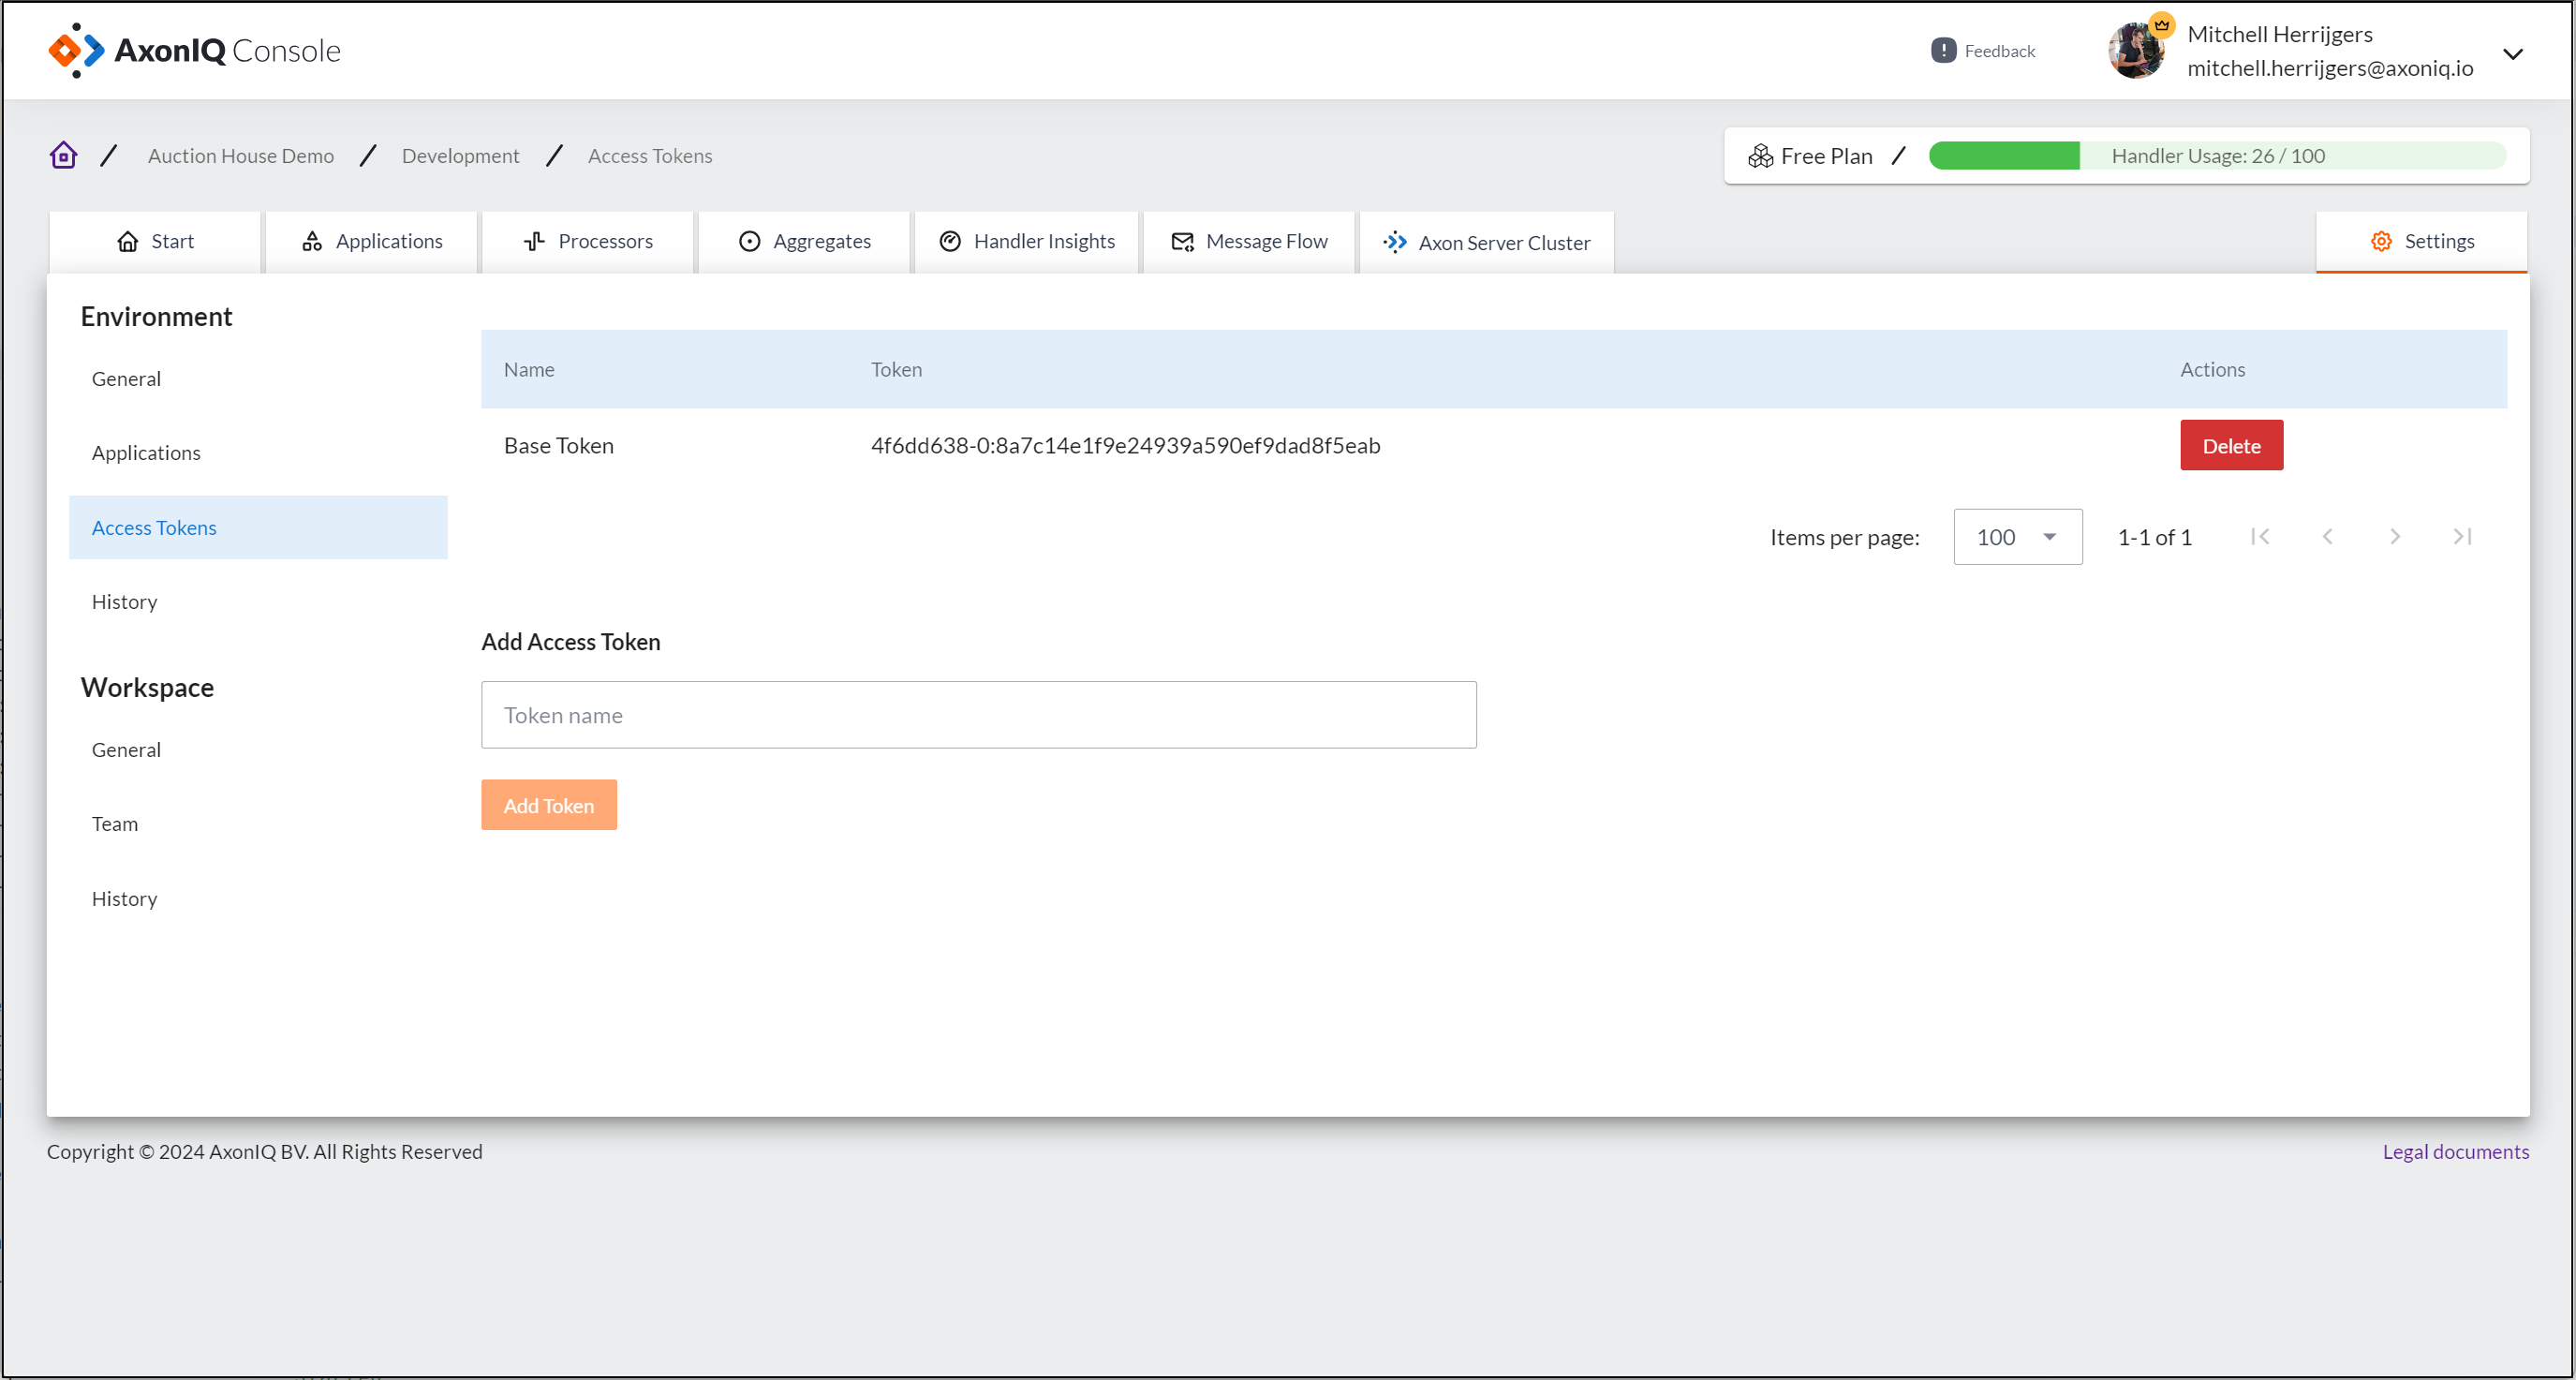
Q: Where can I manage my Access Tokens?
Answer: To manage any of your Access Tokens, navigate to Settings → Environment → Access Tokens
Q: How can I manage my Workspaces?
Answer: Like with your Access Tokens, Workspace management can also be performed within the Setting tab. Navigate to Settings → Workspace → General.
Q: I have a Premium plan, so how can I add a New User?
Answer: If you have a Premium or Enterprise plan, and you are an Admin or Workspace owner, navigate to Settings → Workspace → Team in order to add a new user.
Q: What data types are sent to AxonIQ Console for processing?
Answer: AxonIQ Console was designed to allow developers to log in anywhere and manage their Axon Framework applications and Axon Server instances. Therefore, as a cloud-based product, your applications will periodically (or upon request) send statistical information to the servers of AxonIQ, such as:
-
Generic event processor information (name, latency, status, position)
-
Generic handler statistics (name, latency, throughput, error rates)
-
Dead Letter Queue Information (name, error info, event payload), which is disabled by default
Q: Are my Message Payloads being sent for processing in AxonIQ Console?
Answer: No. By default, neither your message payloads nor IDs are sent to AxonIQ servers for processing within AxonIQ Console. If you decide to enable the Dead Letter Queue functionality, then your DLQ IDs and event payload are retrieved and presented to you in the user interface. This allows you to determine if the dead letter should be deleted or retried.